Trace view N. R. Tallent et al. 2011 is a time-centric user interface for interactive examination of a sample-based time series (hereafter referred to as a trace) view of a program execution. Trace view can interactively present a large-scale execution trace without concern for the scale of parallelism it represents.
To collect a trace for a program execution, one must instruct HPCToolkit's measurement system to collect a trace.
When launching a dynamically-linked executable with hpcrun, add the -t flag to enable tracing.
When launching a statically-linked executable, set the environment variable HPCRUN_TRACE=1 to enable tracing.
When collecting a trace, one must also specify a metric to measure. The best way to collect a useful trace is to asynchronously sample the execution with a time-based metric such as REALTIME, CYCLES, or CPUTIME.
| Trace dimensions |
|---|
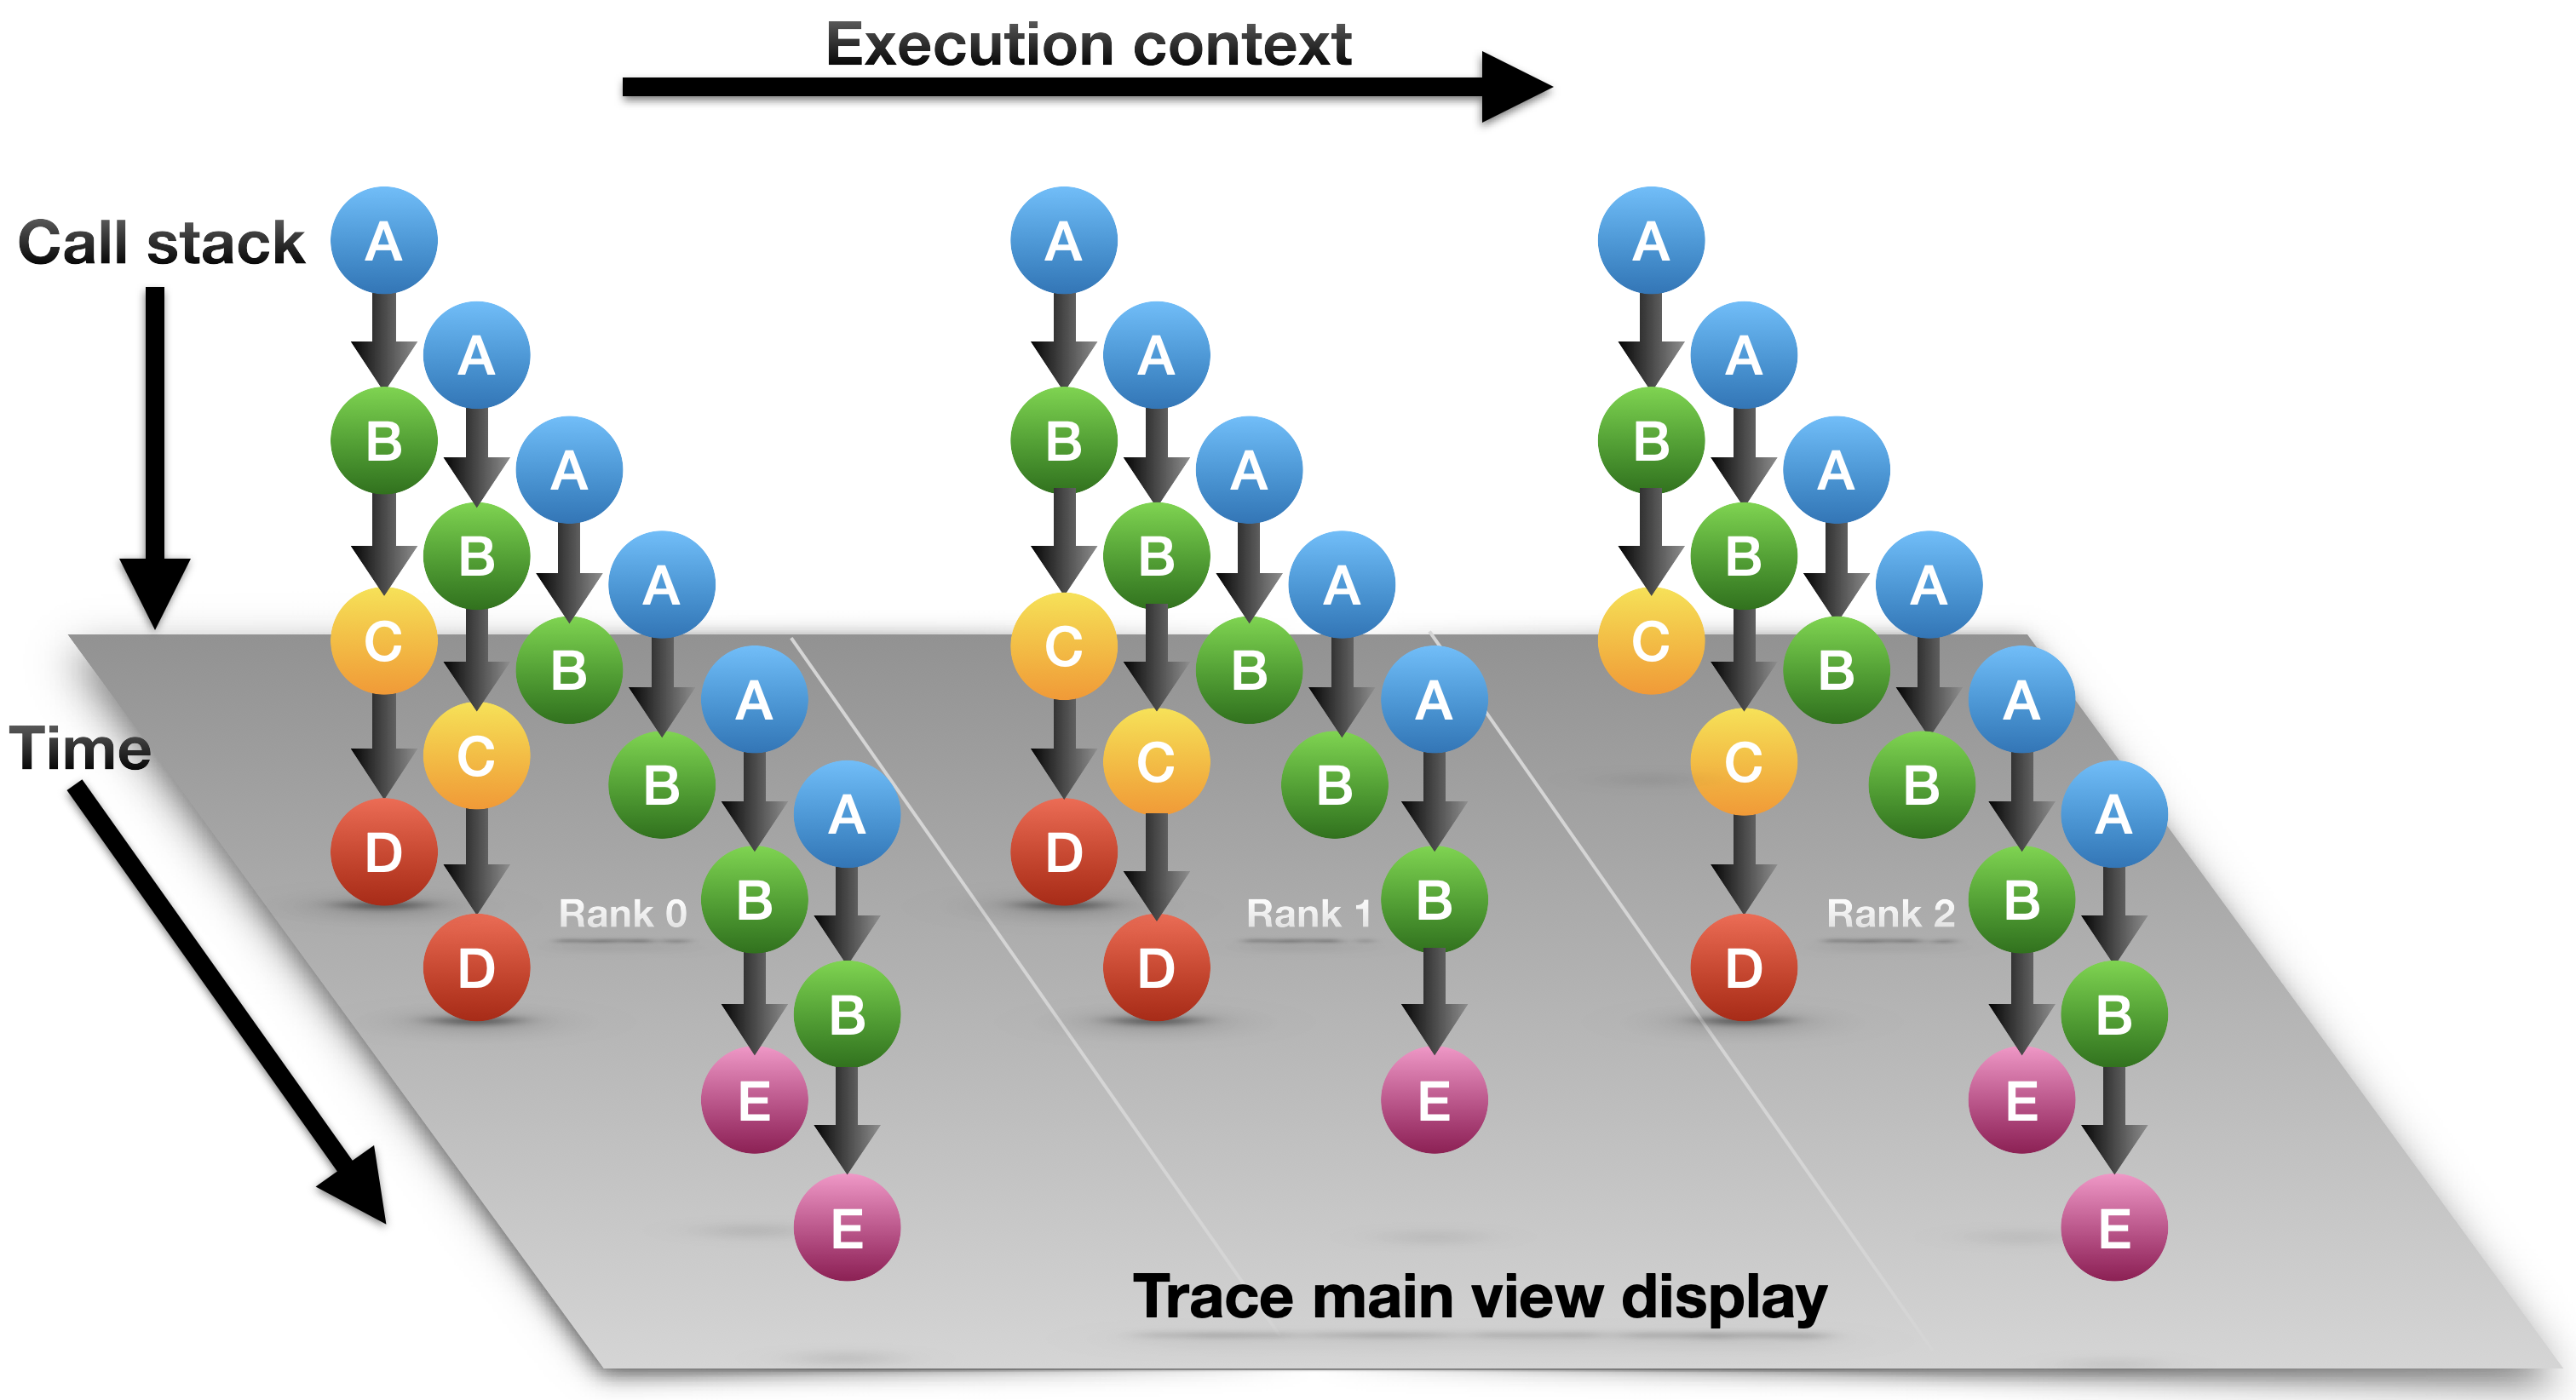 |
| The logical view of traces of call-path samples on three dimensions: time, execution context (rank/thread/GPU), and call stack (also known as call-path). |
As shown in the Trace dimensions figure above, call-path traces consist of data in three dimensions: execution context (also called profile) representing a process or a thread rank or a GPU stream, time, and call stack.
A crosshair in Trace view is defined by a triplet (p,t,d) where p is the selected process/thread rank, t is the selected time, and d is the selected call stack depth.
Trace view renders a view of processes and threads over time. The Depth View shows the call stack depth over time for the thread selected by the cursor. Trace view's Call-stack View shows the call stack associated with the thread and time pair specified by the cursor. Each of these views plays a role in understanding an application's performance.
In the Trace view, each procedure is assigned a specific color. The Trace dimensions figure above shows that at depth 1, each call stack has the same color: blue. This node represents the main program that serves as the root of the call chain in all processes at all times. At depth 2, all processes have a green node, which indicates another procedure. At depth 3, in the first time step, all processes have a yellow node; in subsequent time steps, they have purple nodes. This might indicate that the processes are first observed in an initialization procedure (represented by yellow) and later observed in a solve procedure (represented by purple). The pattern of colors that appears in a particular depth slice of the Main View enables a user to visually identify inefficiencies such as load imbalance and serialization.
| Trace view with legends |
|---|
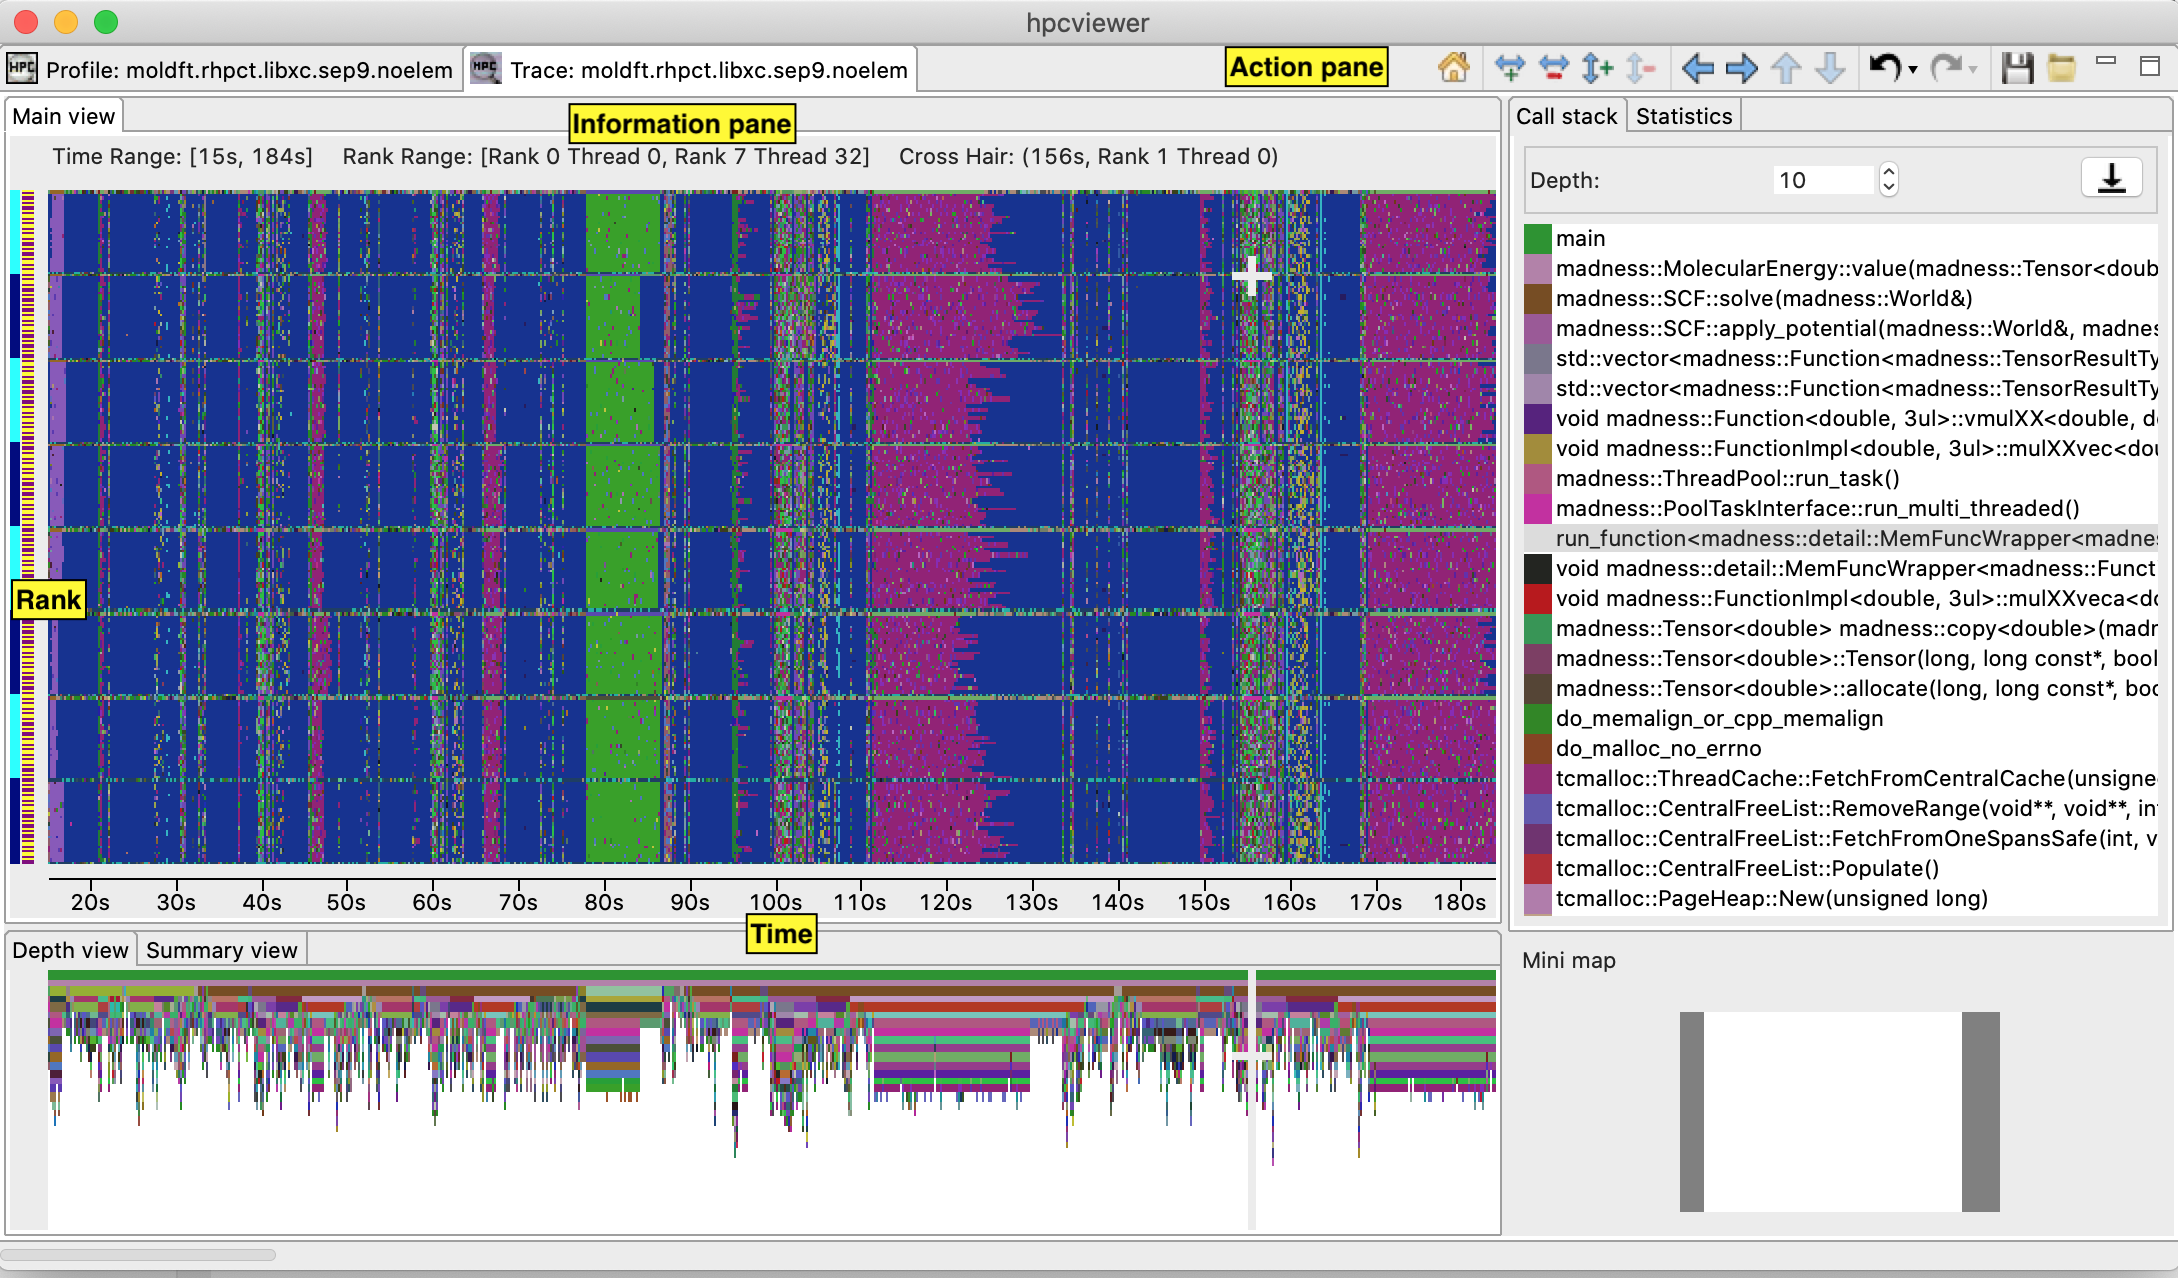 |
| A snapshot of traces of an MPI+OpenMP program. The main view shows the Rank or Execution context as the Y-axis and the program execution time as the X-axis. |
The above Trace view figure highlights Trace view's four principal window panes: Main View, Depth View, Call Stack View, and Mini Map View, while the Trace view figure below shows two additional window panes: Summary View and Statistics View:
| Trace view with the Summary View and Statistics View |
|---|
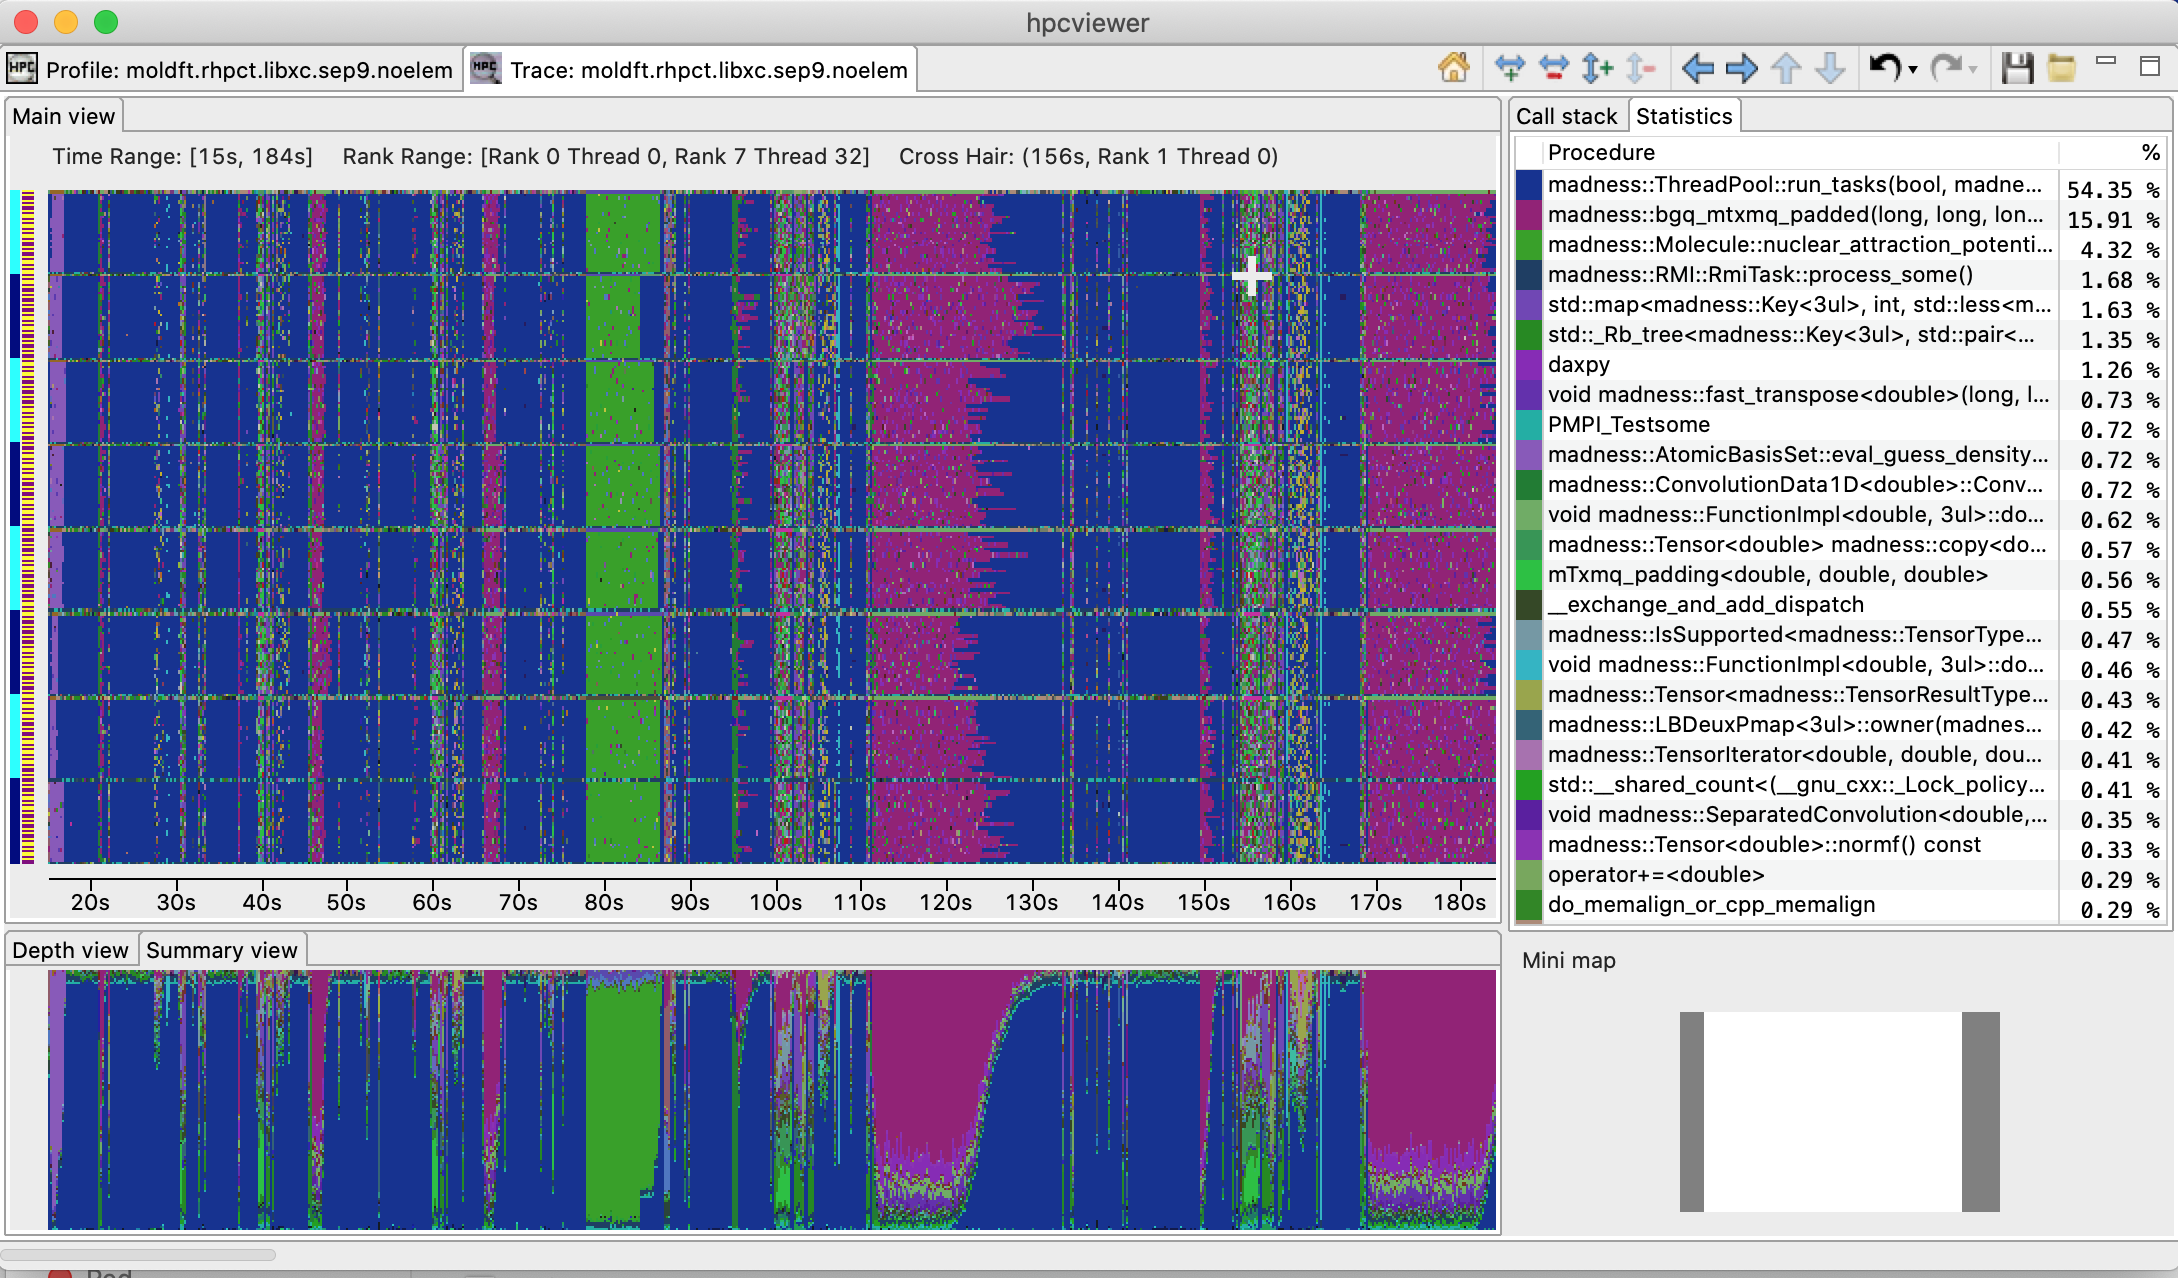 |
A screenshot of hpcviewer's Trace view showing the Summary View (tab in bottom, left pane) and Statistics View (tab in top, right pane) |
t can be done by clicking a pixel within Depth View. This will update the crosshair in Main View and the call path in Call Stack View.t_m,t_n] = {t | t_m <= t <= t_n} is performed by first clicking the position of t_m and dragging the cursor to the position of t_n. A new content in Depth View and Main View is then updated. Note that this action will not update the call path in Call Stack View since it does not change the position of the crosshair.Call Stack View (top tab, right pane): This view shows two things:
Statistics View (top tab, right pane, not shown): This view shows the list of procedures active in the space-time region shown in the Main view at the current call stack depth. Each procedure's percentage in the Statistics view indicates the percentage of pixels in the Main view pane filled with this procedure's color at the current Call stack depth. When the Main view is navigated to show a new time-space interval or the call-stack's depth is changed, the statistics view will update its list of procedures and the percentage of execution time to reflect the new space-time interval or depth selection.
GPU Idleness Blame View (top tab, right pane, not shown): The view is only available if the database contains information on GPU traces. It shows the list of procedures that cause GPU idleness displayed in the trace view. If the trace view displays one CPU thread and multiple GPU streams, then the CPU thread will be blamed for the idleness of those GPU streams. If the view contains more than one CPU thread and multiple GPU streams, then the cost of idleness is shared among the CPU threads.
Main View is divided into two parts: the top part, which contains action and information panes, and the main canvas, which displays the traces.
The buttons in the action pane are the following:
Home  : Resetting the view configuration into the original view, i.e., viewing traces for all times and processes.
Horizontal zoom in  / out
/ out  : Zooming in/out the time dimension of the traces.
Vertical zoom in  / out
/ out  : Zooming in/out the process dimension of the traces.
Navigation buttons  ,
,  ,
,  ,
,  : Navigating the trace view to the left, right, up and bottom, respectively. It is also possible to navigate with the arrow keys in the keyboard. Since Main View does not support scroll bars, the only way to navigate is through navigation buttons (or arrow keys).
Undo  : Canceling the action of zoom or navigation and returning back to the previous view configuration.
Redo  : Redoing of previously undo change of view configuration.
Save  / Open
  a view configuration : Saving/loading a saved view configuration.
A view configuration file contains information about the process/thread and time ranges shown, the selected depth, and the position of the crosshair.
It is recommended that the view configuration file be stored in the same directory as the database to ensure that it matches the database since a configuration does not store its associated database. Although it is possible to open a view configuration file associated with a different database, it is not recommended since each database has different time/process dimensions and depth.
At the top of an execution's Main View pane is information about the data shown in the pane.
Trace view allows users to customize the color of a specific procedure or a group of procedures.
To do that, one can select the View - Color map menu, and Color Map window will appear as shown below:
| Color map window |
|---|
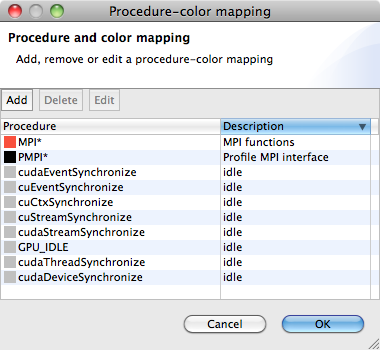 |
This snapshot shows that any procedure names that match with “MPI*” pattern are assigned with red, while procedures that match with “PMPI*” pattern are assigned with black. |
To add a new procedure-color map, click the Add button and a Color map window will appear.
In this window, one can specify the procedure's name or a glob pattern of procedure, and then specify the color to be associated by clicking the color button.
Clicking OK will close the window and add the new color map to the global list.
Note that this map is persistent across sessions, and will apply to other databases as well.
One can select which execution contexts (ranks, threads or GPU streams) to be displayed in Trace View, by selecting the Filter - execution contexts menu.
This will display a filter window that allows to select which execution contexts to show/hide:
| Filter execution context window |
|---|
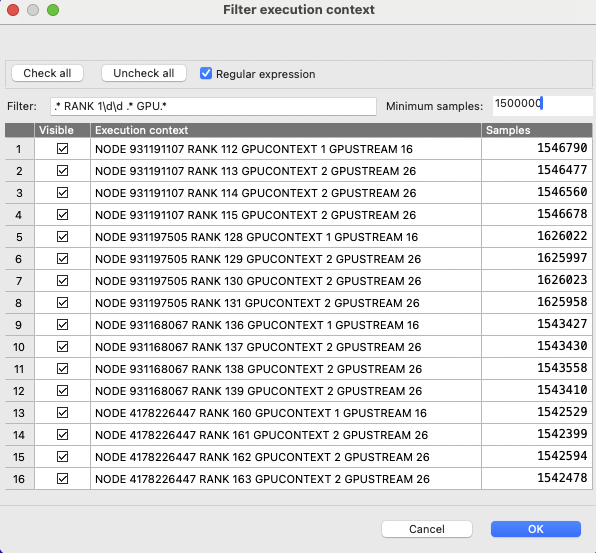 |
| An example of narrowing the list of execution contexts using both a regular expression and the minimum number of samples criteria |
Similar to Profile View's thread selection, one can narrow the list by specifying the name of the execution context on the filter part of the window. In addition, one can also narrow the list based on the minimum number of trace samples (the third column of the table), as shown by the above figure.
MPI_*) to a specific color to approximate its statistic percentage.